An AQL report is meant to provide a clear and objective picture of shipment quality, yet many readers find it confusing at first glance. This usually happens because the report combines statistical sampling, defect classification, and inspection results into a compact document. Once you understand what each part represents and how they connect, reading an AQL report becomes much more straightforward and useful for decision-making.
The report typically starts with general information about the inspection, such as product description, order quantity, inspection date, and inspection type. This section confirms what was inspected and under which conditions. Before looking at the results, it is important to verify that these details are correct, because an accurate conclusion depends on inspecting the right product, quantity, and production stage.
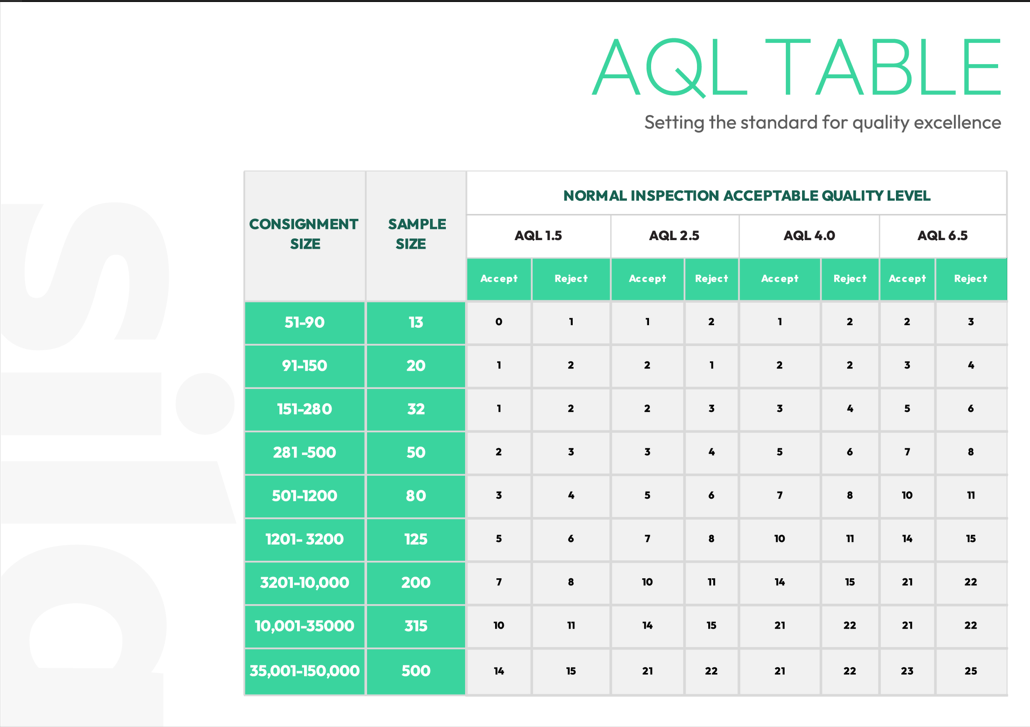
One of the most important elements in the report is the sampling information. Instead of checking every single item, inspectors use internationally recognized AQL sampling tables to select a specific number of samples from the total order. The sample size shown in the report is not arbitrary; it is calculated based on the order quantity and the agreed inspection level. Understanding this helps avoid the common misunderstanding that “only a few pieces were checked without reason.” The sample represents the whole batch statistically, not randomly without structure.
Defect classification is another area that often causes confusion. Defects are usually divided into critical, major, and minor categories. Critical defects are those that may cause safety risks or make the product unusable or illegal to sell. Major defects affect functionality, performance, or appearance in a way that would likely lead to rejection by the end customer. Minor defects are imperfections that do not affect function but still deviate from specifications. The report lists how many defects of each type were found in the sample.
Next comes the acceptance criteria, which is where the Acceptable Quality Level itself applies. For each defect category, the report shows the maximum number of defects allowed in the sample. If the number of observed defects stays within these limits, the shipment can pass. If any limit is exceeded, the result is a fail. This explains why a shipment can fail even when defects seem few in number; it is not the total defects that matter, but whether they exceed the allowed threshold for that sample size and category.
Photos included in the report play a key role in reducing ambiguity. They visually document defects, packaging conditions, labeling issues, and overall product appearance. These images are not just illustrative; they are evidence supporting the inspector’s findings. When reading the report, comparing the written defect descriptions with the photos helps clarify severity and repetition, especially for readers without a technical background.
The overall result, usually marked as pass or fail, should be read together with the detailed findings rather than on its own. A pass does not mean the shipment is perfect, but that defects found are within acceptable limits. A fail does not necessarily mean the entire production is unusable, but that corrective action, sorting, or rework may be needed before shipment approval. Understanding this distinction helps avoid overreaction or misinterpretation of the outcome.
Finally, remarks and conclusions at the end of the report often provide practical context. Inspectors may highlight recurring issues, potential risks, or areas to monitor in future production runs. These comments are valuable because they go beyond numbers and point to underlying causes that may not be immediately obvious from defect counts alone.
Reading an AQL report without technical confusion comes down to viewing it as a structured decision tool rather than a technical test document. By focusing on sampling logic, defect categories, acceptance limits, and visual evidence, anyone involved in sourcing, production, or purchasing can use the report to make informed decisions and improve quality over time.